Take Your Charting to the Next Level
Footprint, Big Trades, liquidity heatmap with an integrated MBO feed and gamma exposure, all under one roof.
XFlow Charts
Billed $59 / Monthly
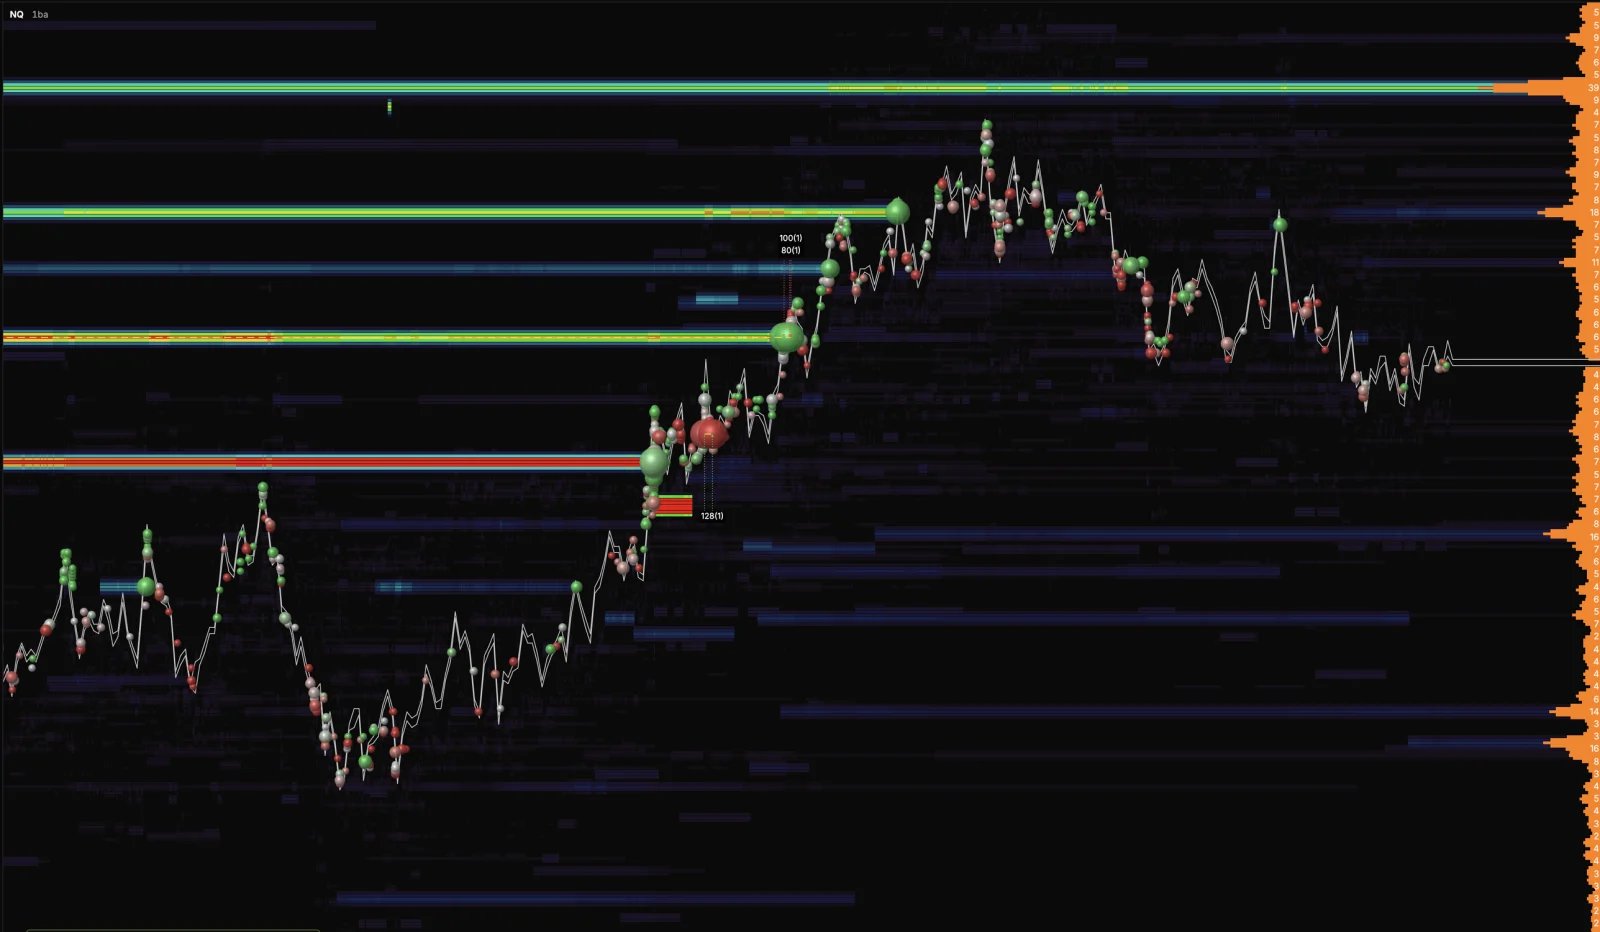
- MBO Liquidity Heatmap
- Big Trades & Icebergs
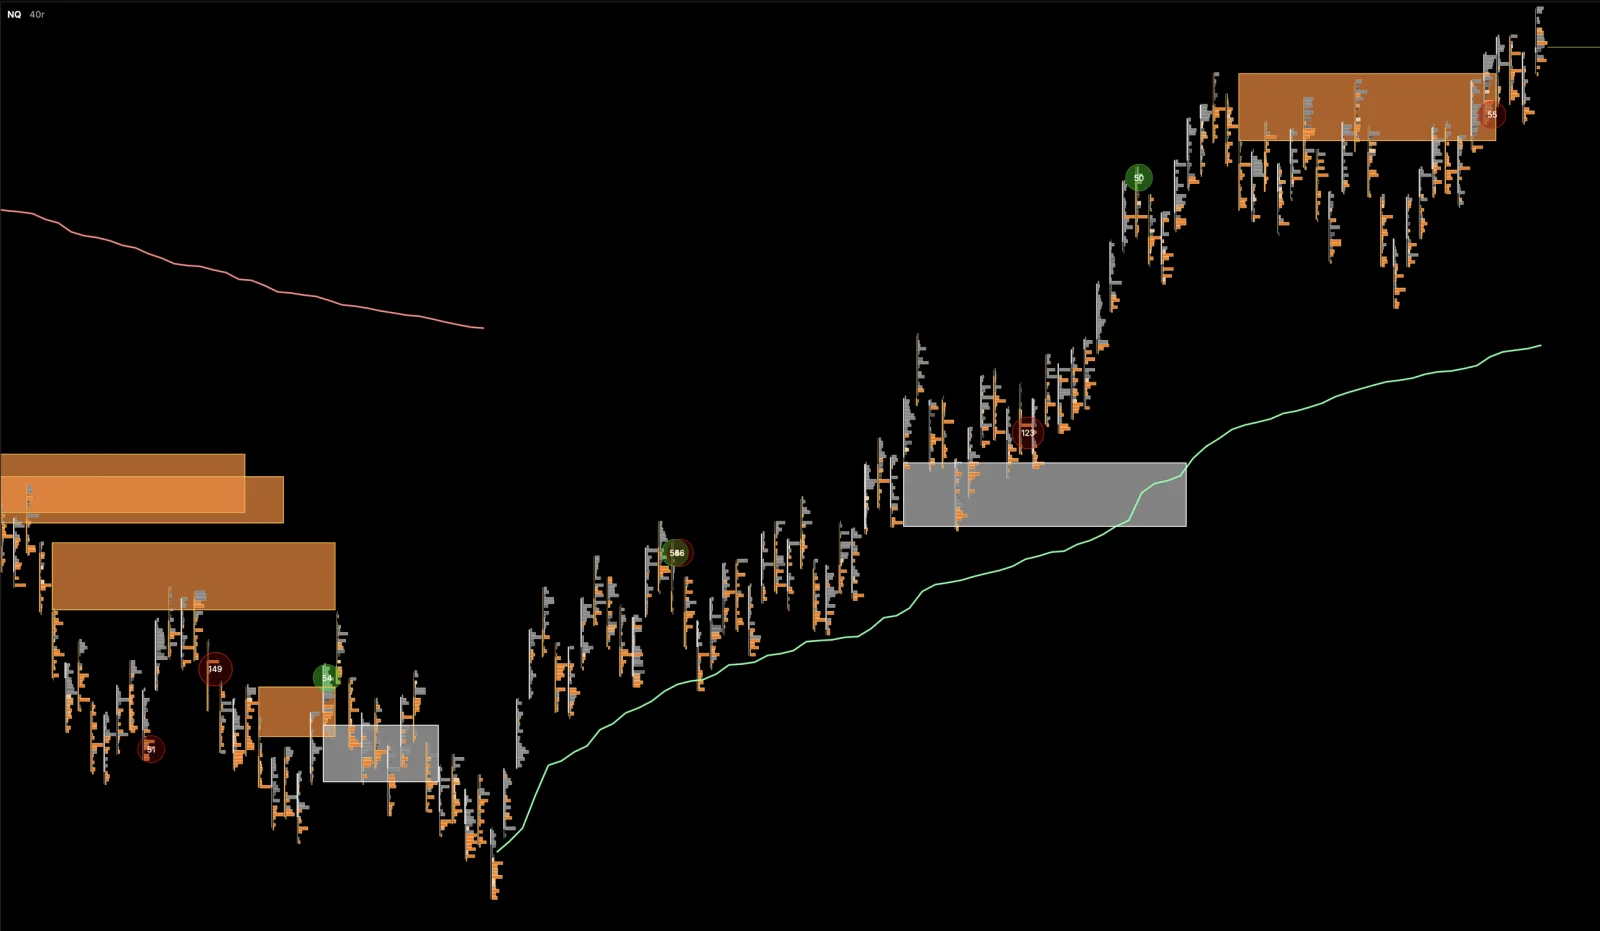
- Footprint & Volume Profile
- Effort Zones & Delta
- GEX Levels & Gamma Heatmap
- Market Replay & Backtesting
- Automated Journal & Report
- Risk Rules & Prop Tools
- XFlow Script Indicator Builder
- Windows, Mac, iPhone, iPad, Android and Browser
- Orderflow Education & Knowledge Base
- XFlow Discord Community



Plans & Features
See what we offer
Orderflow & Volume
Bid and ask volume at every price inside a bar, with delta colouring and tick grouping.
Resting book depth drawn through time, with distribution-relative contrast and a resting-time filter.
Composite, per period, visible or custom range volume and delta profiles with POC and value area.
Single prints at or above your size threshold, marked on the chart from the raw tape.
A running sum of bid against ask delta across bars, on any timeframe.
Runs of fast, one-sided range bars become a zone, ended by the first bar closing through it.
Tape speed per second over a rolling window, with a bar drawn once it reaches a fixed threshold.
A price ladder with depth, order counts, pull and stack, a profile column and click to trade.
The tape in its own window, coloured by how many book levels each aggressor consumed.
MBO Features
These read the book order by order, so they need Market Depth (L2) on your own dxFeed subscription.
Orders that keep refilling at one price, flagged per order with the total they filled.
The aggressor order itself, marked at its execution price and sized by the contracts it took.
The live depth ladder beside the heatmap drawn one box per resting order, above a size floor.
Options Gamma
Gamma comes from your own connected GEXBot key, at the tier that key carries.
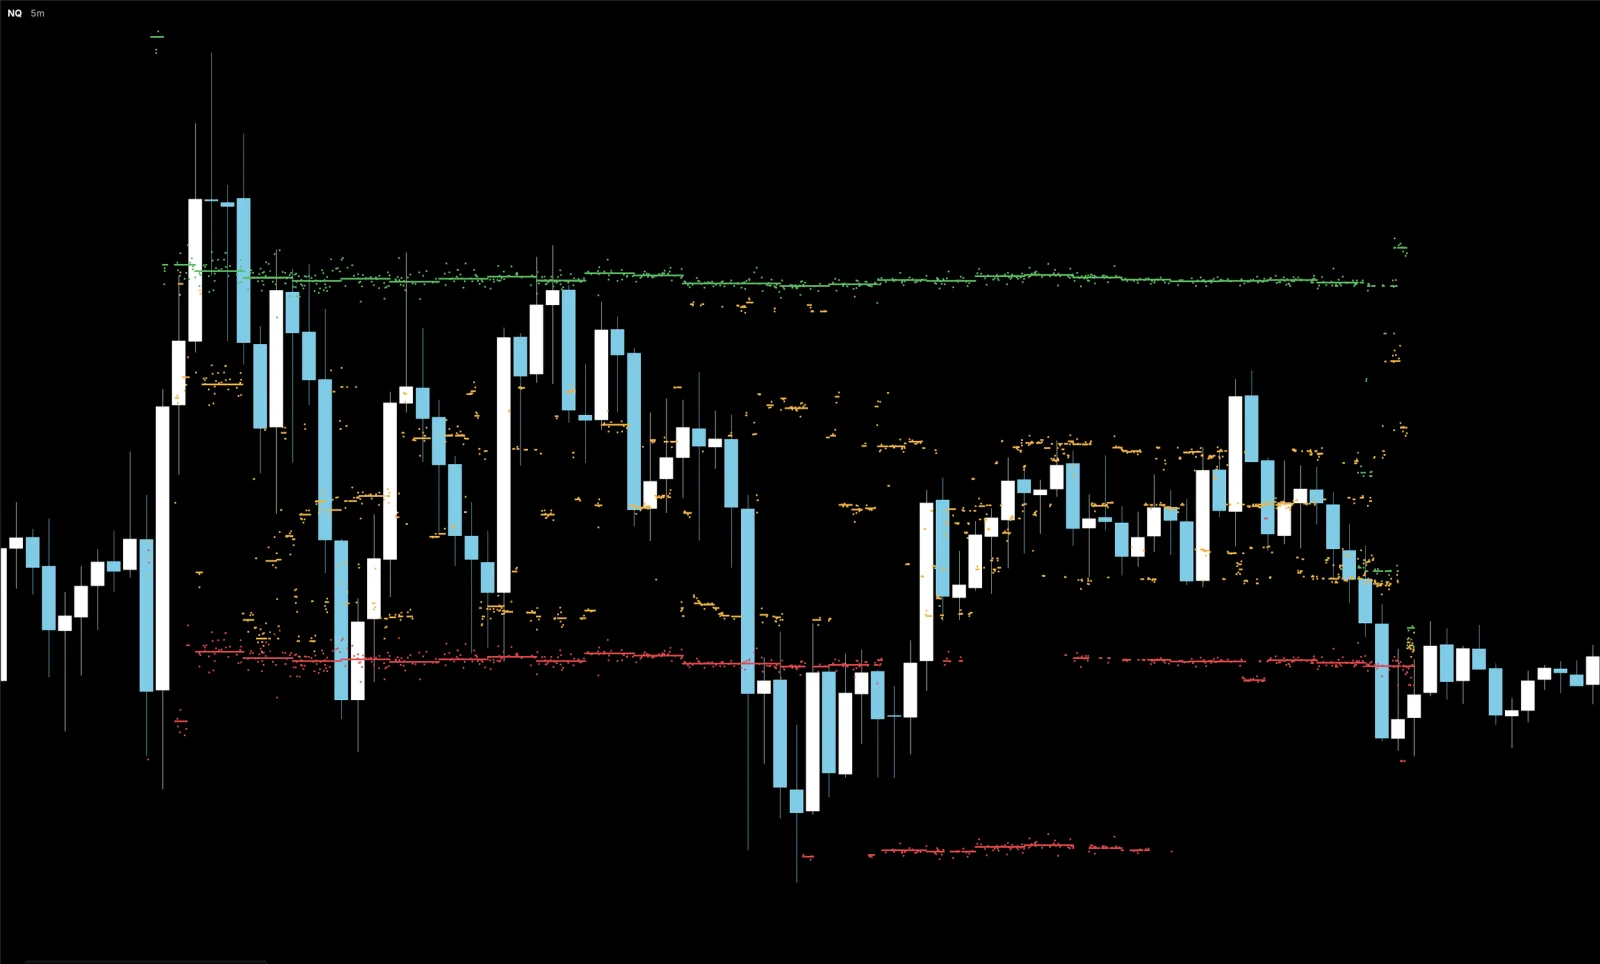
Lines at zero gamma, the major positive and negative walls and the max change strike.
Per strike gamma as a heatmap through time, with the wall levels and history trails.
A per strike gamma histogram: call gamma right of the zero line, put gamma left of it.
Data & Markets
Index, micro, energy, metal, bond, FX, agricultural and single stock roots across the four venues.
Chart data comes through your own dxFeed or Rithmic login, and backtesting runs on dxFeed. Rithmic also connects for orders, positions and accounts.
Time, range, volume, tick, delta and renko bars, all folded from the prints on your own feed.
Twenty years of daily, weekly and monthly bars, stitched from dated contracts on your own feed.
Backtesting & Journal
Replay a past session from 1x to 200x, stepped or paused, and trade it on a simulated account.
Footprint, heatmap and the depth ladder all replay together off the recorded per order book.
Closed trades post themselves into the journal linked to the account, sim and broker alike.
A MultiCharts style report: strategy, trade, periodical, Monte Carlo and graph analysis.
Trading & Risk
Place, move and cancel orders on the chart and on the ladder, with SL and TP in ticks or money.
Loss limits, drawdown floors, daily profit stops and quantity caps; a soft breach pauses the day.
Track a real prop account or run a sim that mirrors its drawdown, target and payout rules.
Practice accounts with their own balance and stats, usable live and in replay, journal linked.
General
A Windows and Mac desktop app, an iPhone and iPad app, an Android build, and the browser.
Saved on the account, so every window with its symbol, indicators and drawings reopens anywhere.
Price alerts on horizontal lines and zones, watched server side, with sound, popup and push.
Write or paste XFlow Script and draw your own indicator on the same data the chart draws.
Guides for getting started, charts, indicators, trading, backtesting and common issues.
An open Discord server for XFlow Charts traders.
